Ask someone to name America’s pie, and apple is an understandable answer. Ask what belongs on the Thanksgiving table, and pumpkin enters the conversation. Look at state-level shopping patterns, and the dessert counter gets more interesting.
Peanut butter pie stands out in Pennsylvania. French silk makes a showing in Illinois. In Maine, cream pies have their own place in the holiday picture.
These results come from two Instacart reports published in 2025 that use 2024 purchasing data. They describe shopping through the platform, not every pie bought, baked, or eaten in America.
There is another important distinction: the state findings concern “most uniquely popular” pies. That is not the same as the pie selling the most units in a state. The reports distinguish regional standouts from national bestsellers. However, the original posts do not provide enough methodological detail to reproduce the state comparisons independently.
With that distinction in mind, these eight state results offer a varied view of America’s dessert preferences.

California: Pumpkin Pie
California appears among the pumpkin-pie states in the Thanksgiving 2024 report, alongside Oregon and Washington.
That places its holiday result close to the national picture. Pumpkin led Thanksgiving pie purchases, with apple and pecan completing the top three.
The state result is not the whole California story, though. In the separate full-year report, San Francisco stood out for key lime pie, which customers ordered more than six times as often as the national average.
A statewide pattern can coexist with a different city-level result. Neither needs to cancel the other.
Texas: Pecan Pie
Texas was one of the states where pecan pie stood out during Thanksgiving week. Mississippi and Oklahoma fell into the same group.
Nationally, pecan pie placed third in both the Thanksgiving results and the separate full-year ranking. In the full-year report, it accounted for 9% of pie sales on the platform.
That gives the Texas result useful context: pecan was a regional standout while also remaining a substantial part of nationwide purchases.
The Thanksgiving pie report establishes the state connection without proving that every Texas household prefers pecan.
Georgia: Sweet Potato Pie
Georgia joined Maryland and North Carolina as a sweet-potato-pie standout in the Thanksgiving report.
Sweet potato also made the national holiday top five, behind pumpkin, apple and pecan. Cherry completed that group.
The separate full-year city analysis adds another perspective: Atlanta customers ordered sweet potato pie 6.5 times as often as the national average.
Those findings concern different periods and geographic levels. Together, however, they make Georgia one of the clearest examples of a regional pie connection in the platform’s data.
Illinois: French Silk Pie
Illinois adds chocolate to the state-by-state picture.
French silk pie stood out there during Thanksgiving week, with Iowa and Missouri appearing alongside it. The report describes the pie as having a smooth chocolate filling and a whipped cream topping.
It is a distinct change from the pumpkin, pecan, and sweet potato results elsewhere. A holiday table does not have to follow a single autumn-flavor script.
The Illinois result doesn’t explain why shoppers chose French silk. Its value is simpler: it identifies a chocolate-based standout in a comparison often associated with fruit, nuts, and seasonal fillings.
Related: 8 Cheap Fast-Food Meals That Could Be Costing You More Than You Think
Pennsylvania: Peanut Butter Pie
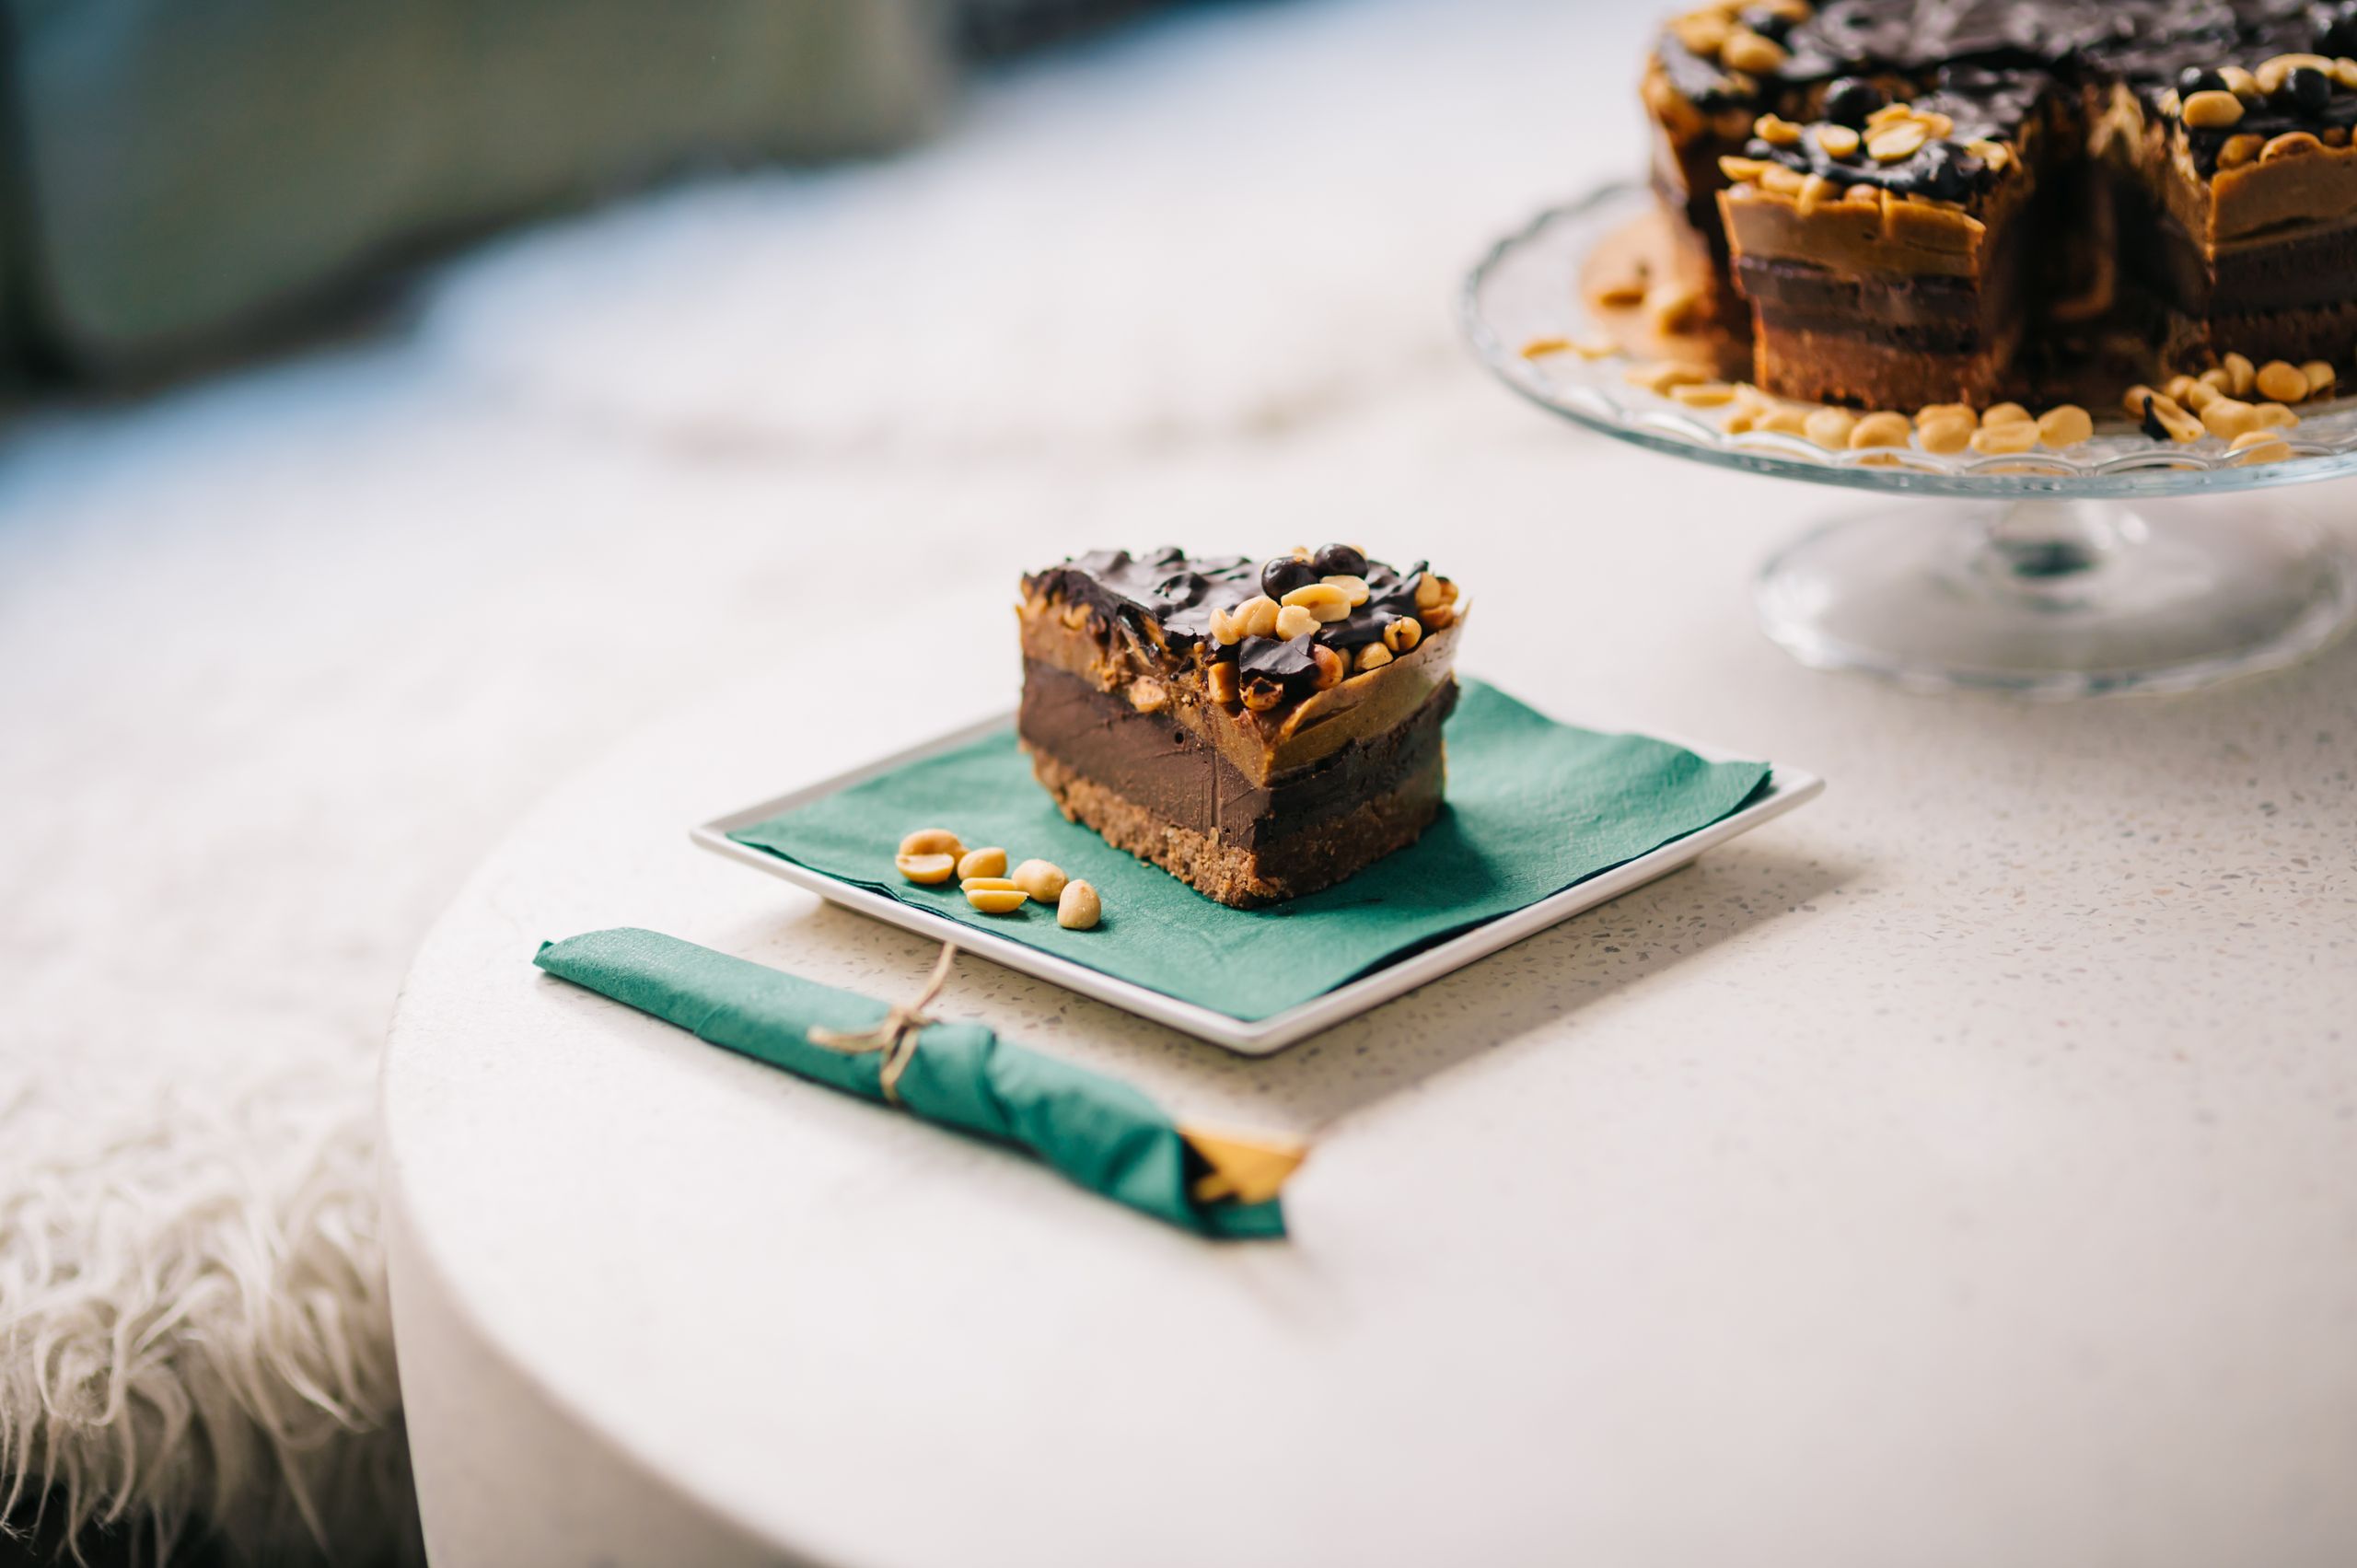
Pennsylvania’s Thanksgiving standout was peanut butter pie.
That result gives the holiday map another direction. Rather than treating every state as a variation on pumpkin or pecan, the report includes a different flavor among its regional findings.
Independent coverage of the Thanksgiving results also highlights Pennsylvania’s peanut butter pie connection.
That coverage is an account of the same Instacart data, not a second study confirming it. The distinction matters: multiple articles can report one finding without representing multiple independent measurements.
Maine: Cream Pies
Maine appeared among the cream-pie standouts in the Thanksgiving report, alongside Massachusetts.
The broad category deserves to remain broad. The report’s written summary doesn’t justify replacing “cream pies” with a specific flavor like banana or coconut.
That may make the entry less tidy, but it keeps the result faithful to the source.
It also introduces another variation in the holiday lineup. Not every regional standout has a particular fruit or nut in its name, and not every state result needs to be more specific than the published evidence allows.
Maryland: Sweet Potato Pie
Maryland shared Georgia’s sweet-potato-pie distinction during Thanksgiving week, but its city-level result tells a different story.
In the full-year report, Baltimore stood out for lemon meringue pie, with orders three times as frequent as the national average.
This is not a contradiction. Maryland’s holiday finding and Baltimore’s annual result describe different locations and time windows.
For readers, that is a useful reminder to look beyond a map’s label. A state is not one dessert table, and an annual shopping pattern need not match a holiday-week snapshot.
Vermont: Blueberry Pie
Vermont’s result comes from the full-year analysis, not the Thanksgiving comparison used for most entries here.
Blueberry was identified as its most uniquely popular pie, a distinction shared with Massachusetts, Connecticut and Rhode Island.
The full-year pie report also found apple leading nationwide at 29% of pie sales, followed by pumpkin at 23%.
Vermont therefore illustrates the difference between a national leader and a state standout. Apple can lead overall while blueberry supplies a more distinctive regional result.
A Map, Not a Verdict
These findings describe one platform’s purchases during specified periods. They do not count homemade pies or establish what every resident considers a favorite.
They offer a starting point for a more interesting dessert conversation. If your table included one familiar pie and one choice inspired by another state, which pairing would you serve, and what might you discover in that second slice?