There’s something special about wandering through a farmers market. The colorful produce, conversations with vendors, and the chance to discover something delicious can turn an ordinary grocery trip into a little adventure.
But where are farmers markets most concentrated across America?
According to a November 6, 2026, analysis by Farmers Market Days, the USDA’s Local Food Directories contained 6,610 farmers-market listings nationwide. That’s approximately 1.9 listed markets per 100,000 residents.
The researchers compared those listings with Census Bureau population estimates from July 2024 to identify states with the highest concentration of registered markets.
The results might surprise you. California had more listed markets overall, but smaller states dominated when population was considered.
Here are the 12 states leading that comparison.
Vermont: America’s Farmers Market Density Leader
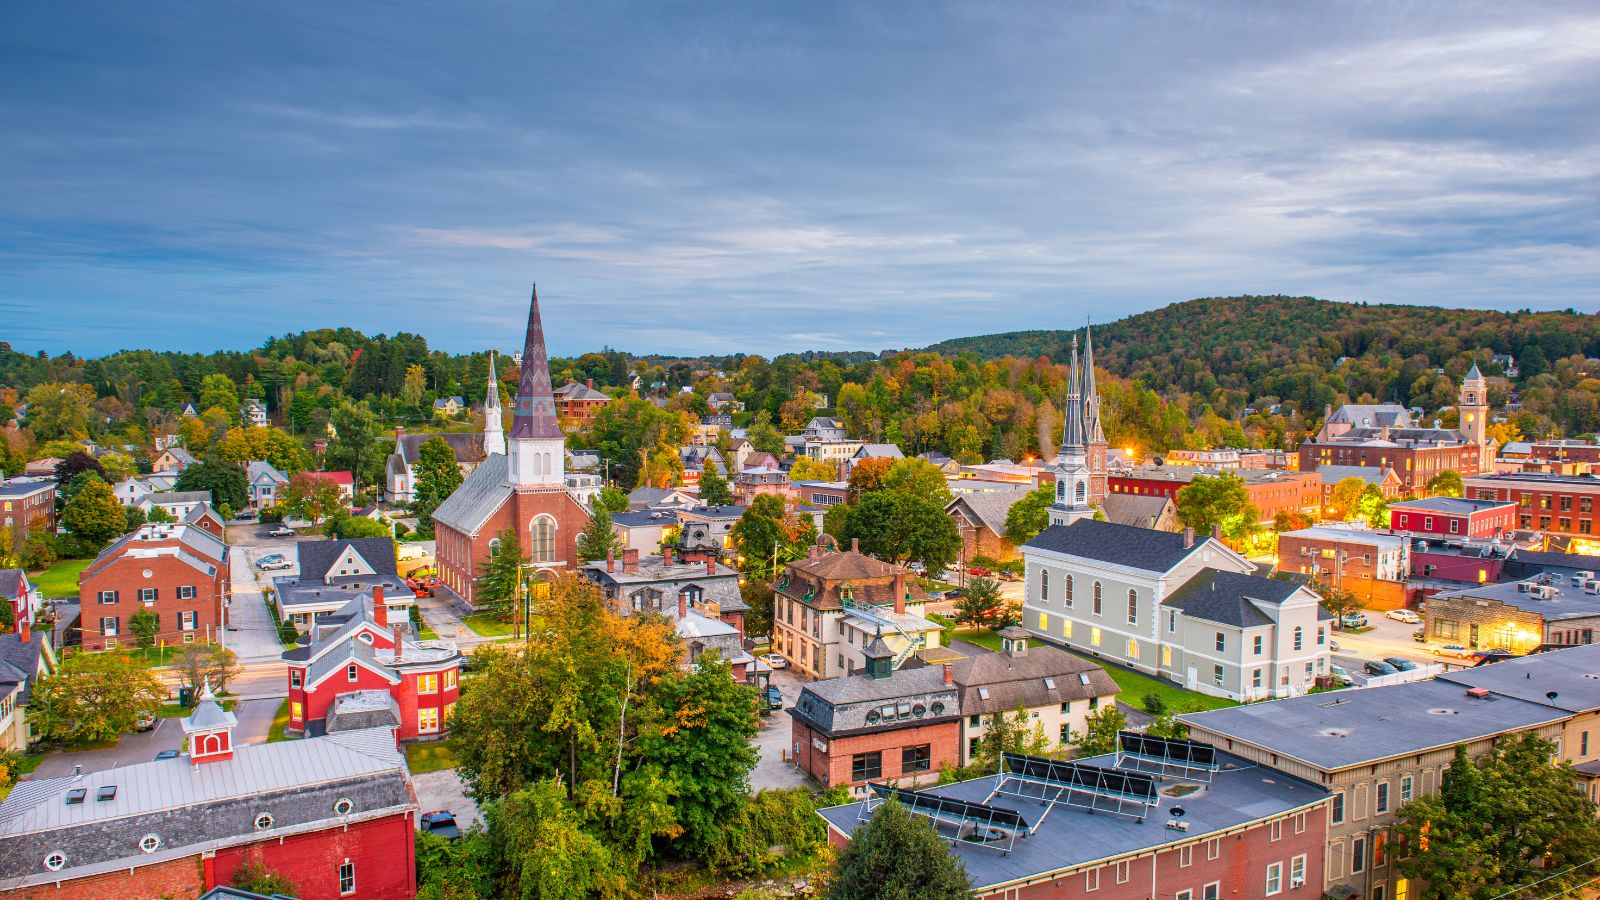
Vermont ranks first in the Farmers Market Days analysis. With 72 USDA-listed farmers markets and approximately 11.1 per 100,000 residents, the state leads the country on this particular measure. That’s an impressive concentration for a relatively small state.
However, the figure measures directory listings, not how frequently residents shop or how much vendors sell.
Still, Vermont’s first-place position provides an interesting starting point for anyone curious about where farmers markets appear most prominently relative to population.
Wyoming: A Small Population Makes a Big Difference
Wyoming follows closely behind Vermont. The November 2026 analysis identified 58 USDA-listed farmers markets, equivalent to 9.9 per 100,000 residents.
That’s fewer markets than several larger states, but the population-adjusted comparison places Wyoming second. It’s a reminder that raw totals don’t always tell the most interesting story.
A state doesn’t need hundreds of registered markets to rank highly when its population is relatively small.
For readers exploring local-food shopping, Wyoming demonstrates why comparing markets per resident produces a different picture from simply counting locations.
Minnesota: An Impressive Number of Listed Markets
Minnesota stands out for a different reason.
According to Farmers Market Days, the state had 394 USDA-listed farmers’ markets in November 2026. That’s the largest total among these 12 states.
Nationally, only California had more listings, with 553. New York followed Minnesota with 393.
Yet Minnesota also performed strongly when adjusted for population, recording 6.8 markets per 100,000 residents.
That combination makes Minnesota notable for both its substantial directory presence and its relatively high concentration.
The figures don’t establish sales or attendance, but they do reveal an extensive network of listed locations.
Alaska: Fewer Listings, Higher Density
Alaska offers another interesting lesson in how population changes the ranking. With 47 USDA-listed farmers markets, its absolute total is considerably smaller than Minnesota’s.
However, the state recorded 6.4 listings per 100,000 residents. That places Alaska fourth among states.
The result doesn’t tell us how close those markets are to individual households or how easily shoppers can reach them.
A statewide average cannot capture every community’s circumstances. Nevertheless, Alaska earns its position because of the number of markets listed relative to its population.
Iowa: A Strong Showing in the Midwest
Iowa ranks fifth in this population-adjusted comparison. The Farmers Market Days analysis counted 185 USDA-listed farmers markets, producing a rate of 5.7 per 100,000 residents.
That’s a substantial directory presence compared with many other states. But don’t mistake a high listing rate for proof that markets are expanding.
The November 2026 figures are a snapshot, not a year-by-year growth study.
What Iowa’s result establishes is simpler: registered farmers markets appear relatively frequently when measured against the state’s population.
Kansas: Another Midwestern State Makes the List
Kansas follows Iowa with 120 USDA-listed farmers markets. The analysis calculates approximately four listings per 100,000 residents. That earns Kansas sixth place among states.
It’s tempting to explain the result through agricultural traditions or local shopping preferences, but this dataset doesn’t establish those connections.
It simply measures how many markets appear in the directory relative to population.
For shoppers, the next step is to check actual locations, schedules, and vendors rather than assuming the statewide figure guarantees a nearby market.
Kentucky: Close Behind Kansas
Kentucky recorded 179 USDA-listed farmers markets, according to the November 2026 figures.
That translates to approximately 3.9 markets per 100,000 residents. Its rate is just below Kansas, although Kentucky has more listed markets overall.
This is another example of why the two measures shouldn’t be confused. A larger total doesn’t necessarily mean a higher concentration.
Kentucky’s seventh-place ranking reflects its relative directory density, not verified consumer spending or market profitability.
Wisconsin: More Than 200 Listed Markets
Wisconsin brings another sizable total to the list. Farmers Market Days identified 218 USDA-listed farmers markets in the state. With 3.7 listings per 100,000 residents, Wisconsin ranks eighth.
Its total exceeds those reported for Kansas and Kentucky, yet its population-adjusted position is lower. That’s exactly why the per-resident calculation matters.
The number of listed locations can be impressive without revealing how accessible individual markets are or how often they’re open.
New Hampshire: A Smaller State With a Notable Ranking
New Hampshire recorded 51 USDA-listed farmers’ markets in the analysis. Its population-adjusted rate was 3.6 per 100,000 residents, placing it ninth.
The relatively small total again shows how the rankings favor market concentration over sheer quantity. But remember that a directory listing isn’t a guarantee of current opening hours.
USDA’s Farmers Market Directory provides location and operating information, which shoppers should confirm before visiting.
Connecticut: A Close Contest Near the Bottom of the List
Connecticut appears tenth with 125 USDA-listed farmers markets. Its rate was 3.4 per 100,000 residents. Interestingly, that displayed rate matches the figure reported for West Virginia.
The published numbers are rounded, so the shared figure shouldn’t be used to claim one state clearly has a higher concentration than the other.
Connecticut’s inclusion reflects its relative directory density, not a separate measurement of customer satisfaction or farmers-market success.
West Virginia: Matching Connecticut’s Displayed Rate
West Virginia had 61 USDA-listed farmers markets in November 2026. Like Connecticut, its published rate was 3.4 per 100,000 residents.
The two states have different raw counts but similar population-adjusted results. That’s one of the most revealing details in this comparison.
The rate allows states of different sizes to be considered on a common basis.
However, it still doesn’t show whether those markets operate year-round or how convenient their locations are for individual households.
Rhode Island: A Small State Rounds Out the List
Rhode Island completes the 12-state selection. The analysis identified 37 USDA-listed farmers markets, equivalent to 3.3 per 100,000 residents. That makes Rhode Island the final state in this particular group.
Washington, D.C., would rank ahead of Minnesota at 7.5 listings per 100,000 residents, but it isn’t included because this list covers states only.
Rhode Island’s position reminds us that even a modest number of listed locations can create a relatively high per-capita rate.
What These Farmers Market Rankings Really Tell Us
The November 2026 Farmers Market Days analysis reveals an interesting contrast between total market counts and population-adjusted concentration.
California led in raw USDA listings, while Vermont and Wyoming ranked highest per resident.
But the study doesn’t establish that these 12 states have the most profitable, fastest-growing, or busiest farmers’ markets.
USDA’s directory is a discovery resource, and participation depends on market operators registering or updating their information. Some markets may be missing, while some listings may no longer be current. That distinction matters.
For anyone who enjoys shopping for fresh ingredients, these figures offer a fascinating look at America’s farmers-market landscape.
And whether you’re browsing a large market or a modest neighborhood gathering, the real pleasure often comes down to something the statistics can’t measure: discovering the ingredients that inspire your next delicious meal.